Evals
Inspect traces and sessions
Use the trace explorer to follow recorded requests and inspect the spans, inputs, outputs and assessments behind an evaluation. Group by a reported session ID when you need a conversation view. These reads do not execute a target again.
Before you start
Section titled “Before you start”Any customer role can inspect authorized native traces in the current beta console. Your organization must have ready Evals setup and retained trace evidence in the selected project. Members or higher can save views; viewers can use organization-shared views. You do not need a separate MLflow login or MLflow credentials.
Complete a first evaluation to create fresh evidence. Not every request reports a session, user, token count, cost or model identity. Missing fields stay unavailable.
1. Find the trace selection
Section titled “1. Find the trace selection”- Open Evals → Traces and confirm the project.
- Enter distinctive input/output text in Search trace content.
- Choose Trace state or Trace order if needed.
- Open More filters for Session ID, User ID, Minimum latency (ms), Time window, Boolean assessment and Assessment value.
- Click Apply filters and read the applied-filter summary and coverage note. Use Reset to clear filters deliberately.
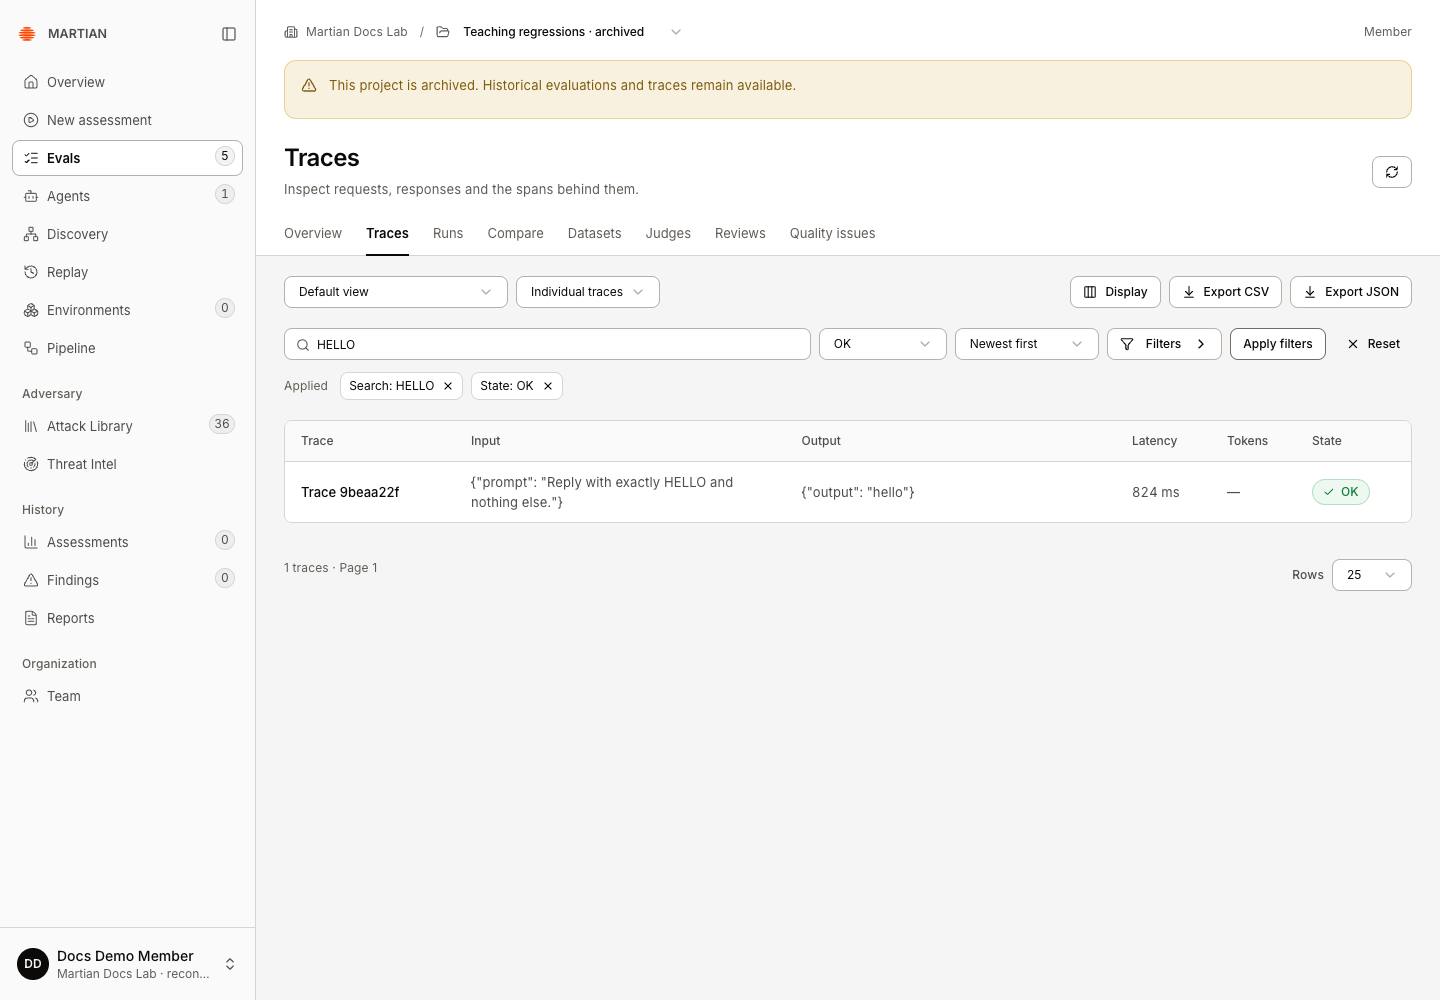
Start with a narrow, known request or recent time window. An empty selection is not proof that the agent never ran; confirm the organization, project, filters and trace retention.
2. Inspect native execution evidence
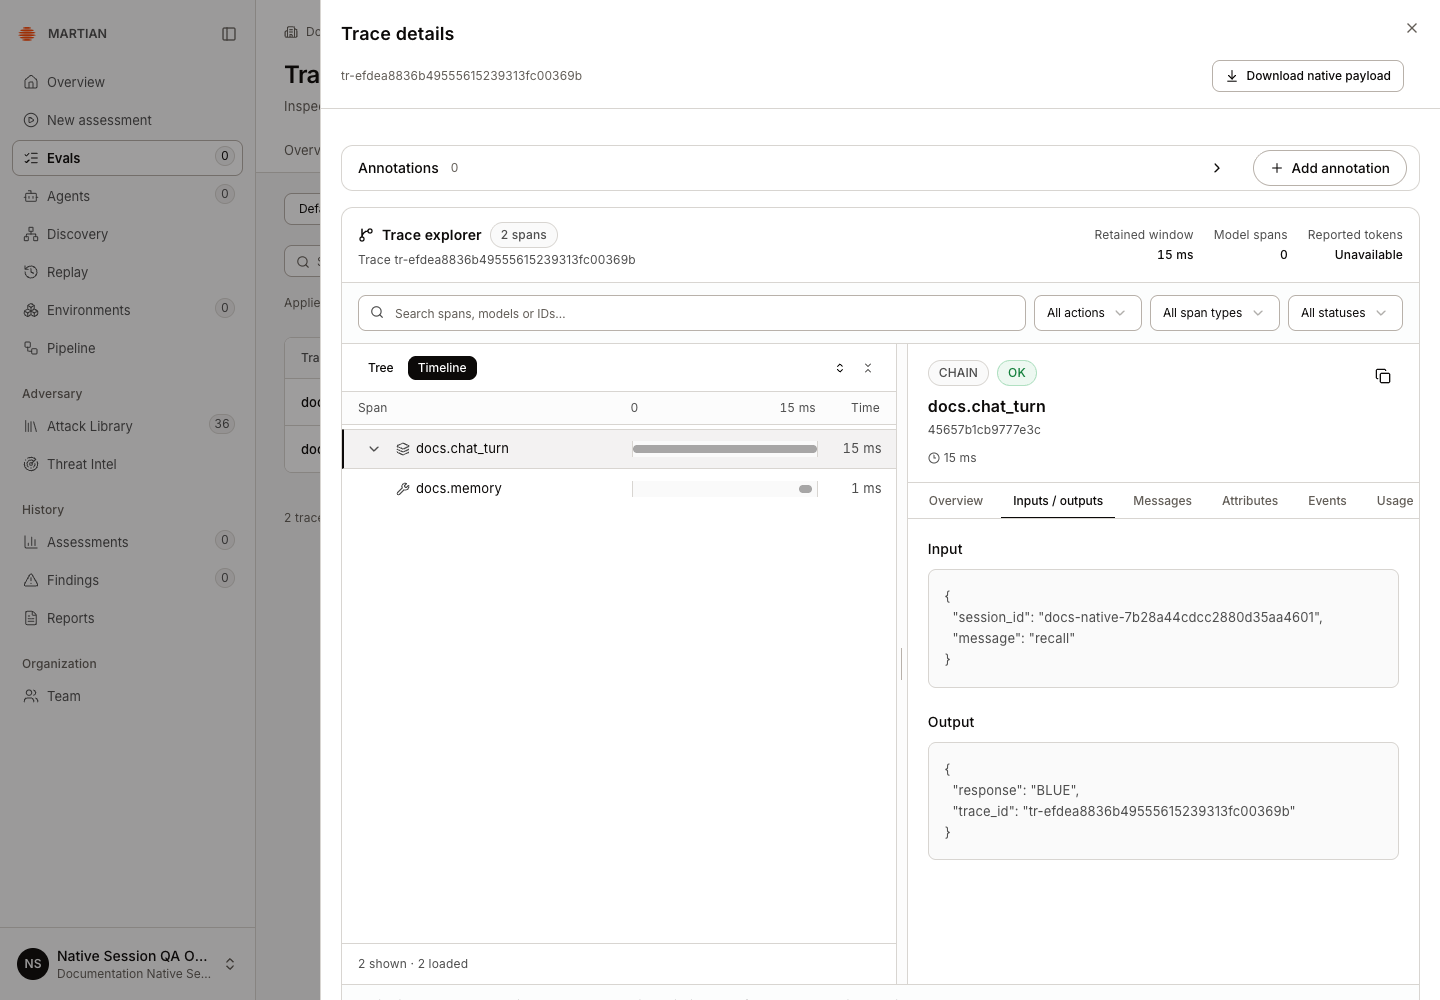
Section titled “2. Inspect native execution evidence”- Open a trace from the table to display Trace details.
- Begin with Inputs / outputs and compare the recorded values with the saved evaluation result.
- Inspect available Overview, Messages, Attributes, Events and Usage tabs. Use the span/tree or timeline controls shown by the inspector for the recorded trace structure.
- Expand Trace assessments and metadata to inspect retained feedback and identifiers.
- Choose Download native payload when you need the retained native evidence for an authorized review.
The capture below shows Trace details opened from the filtered trace table, with two native spans and the recorded input/output. For a trace attached to an evaluation result, you can also use the run’s Results → Inspect → View trace path.
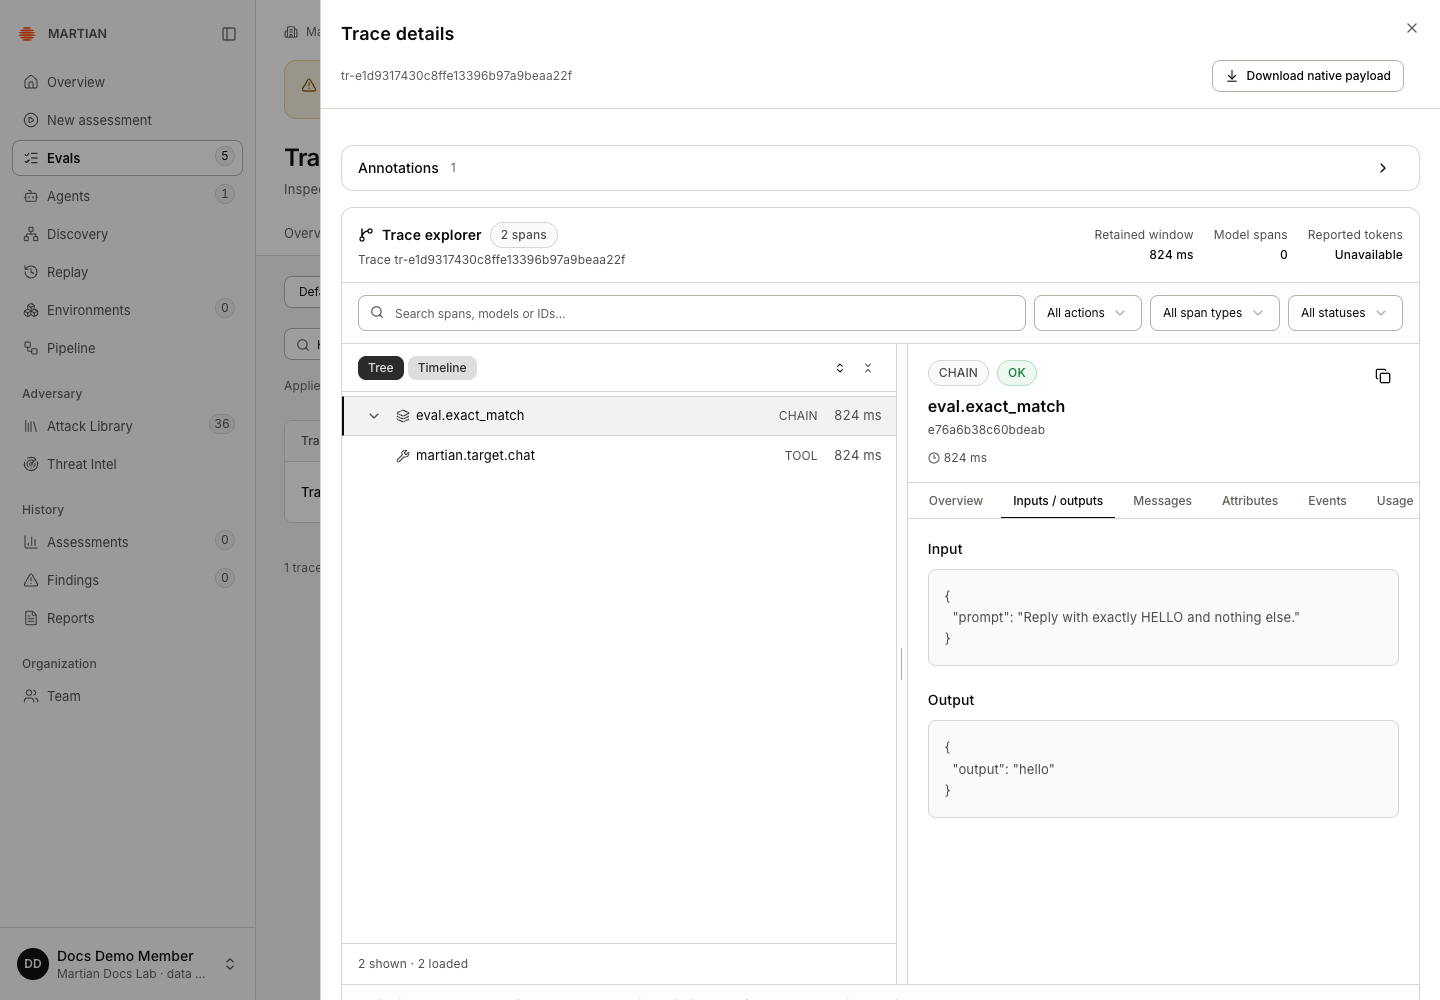
A missing usage field is not zero usage. Reported model names, costs and span events describe what was retained; they do not independently verify billing, deployed code or a business-side effect. Treat trace downloads as potentially sensitive and share them according to your organization’s policy.
To add a human rating or expected behavior, use the separate native annotation workflow. It appends an assessment rather than editing recorded outputs or a dataset answer. That write workflow has its own pending qualification.
3. Group recorded conversations
Section titled “3. Group recorded conversations”The example below uses a separate synthetic HTTP application with native MLflow 3.16.1 instrumentation and an operator-provisioned application writer. Two actual requests stored BLUE, then recalled it. Each request produced a separate completed trace with the same reported session ID. This verifies the conversation view; it does not qualify SDK 0.1.2 ingestion or model behavior. Viewing these records in Martian needs only your normal customer sign-in.
- Return to Traces. To inspect a known conversation, open Filters (More filters to assistive tools), enter its Session ID and click Apply filters. Set Group traces by to Group by session.
- Inspect Recorded sessions, turns, errors and first/last recorded times. This bounded example contains one session, 2 turns, 0 errors and no ungrouped traces.
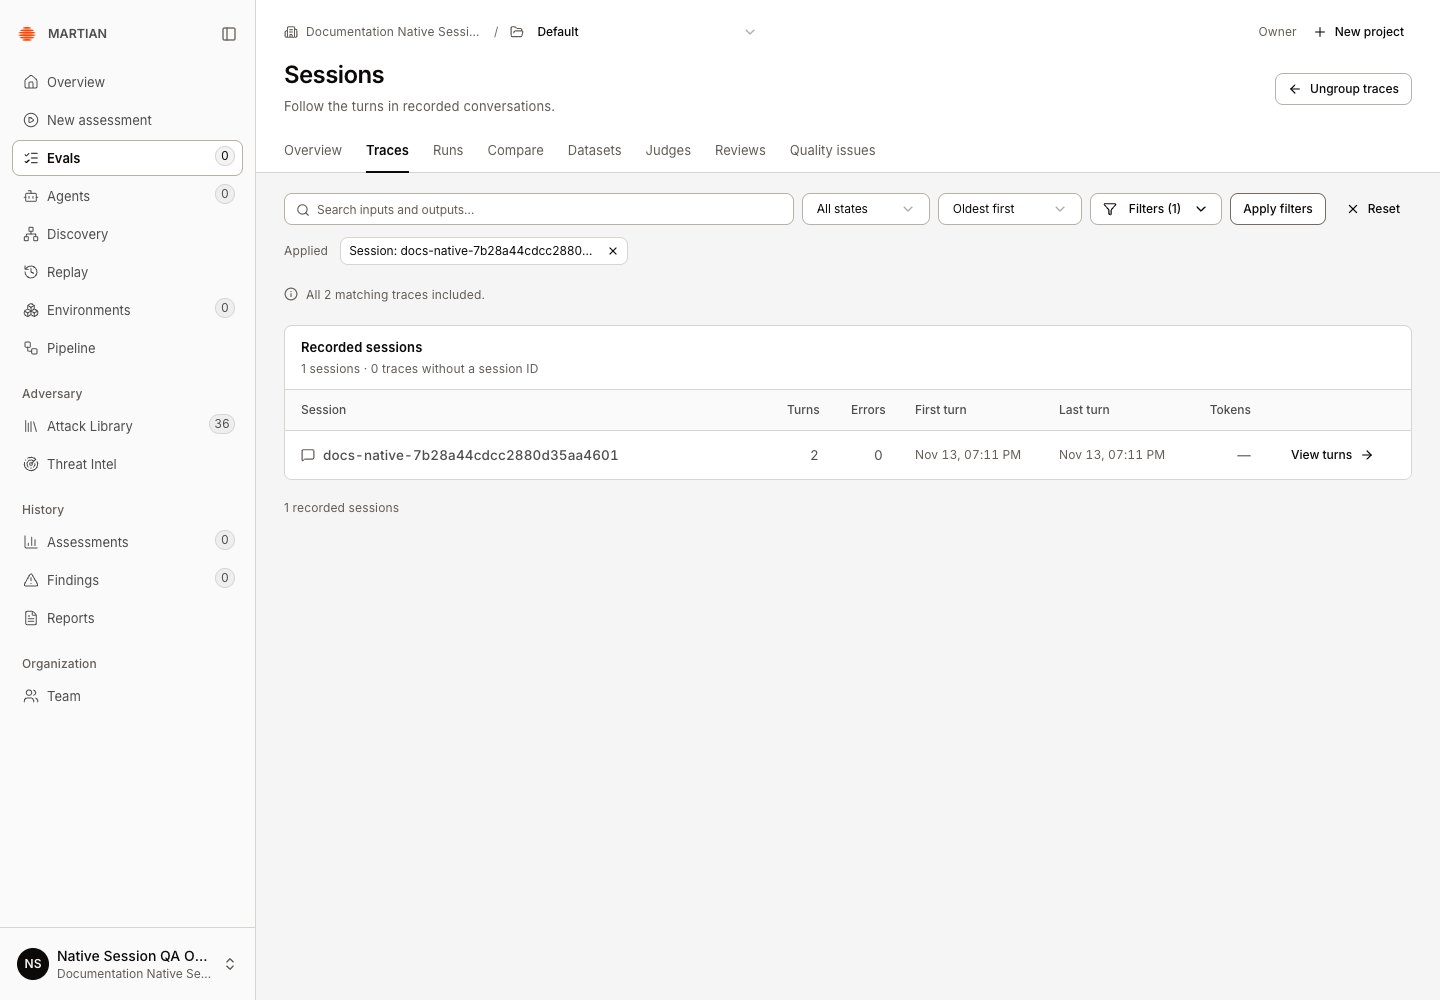
- Choose View turns to inspect one session while retaining its applied filters.
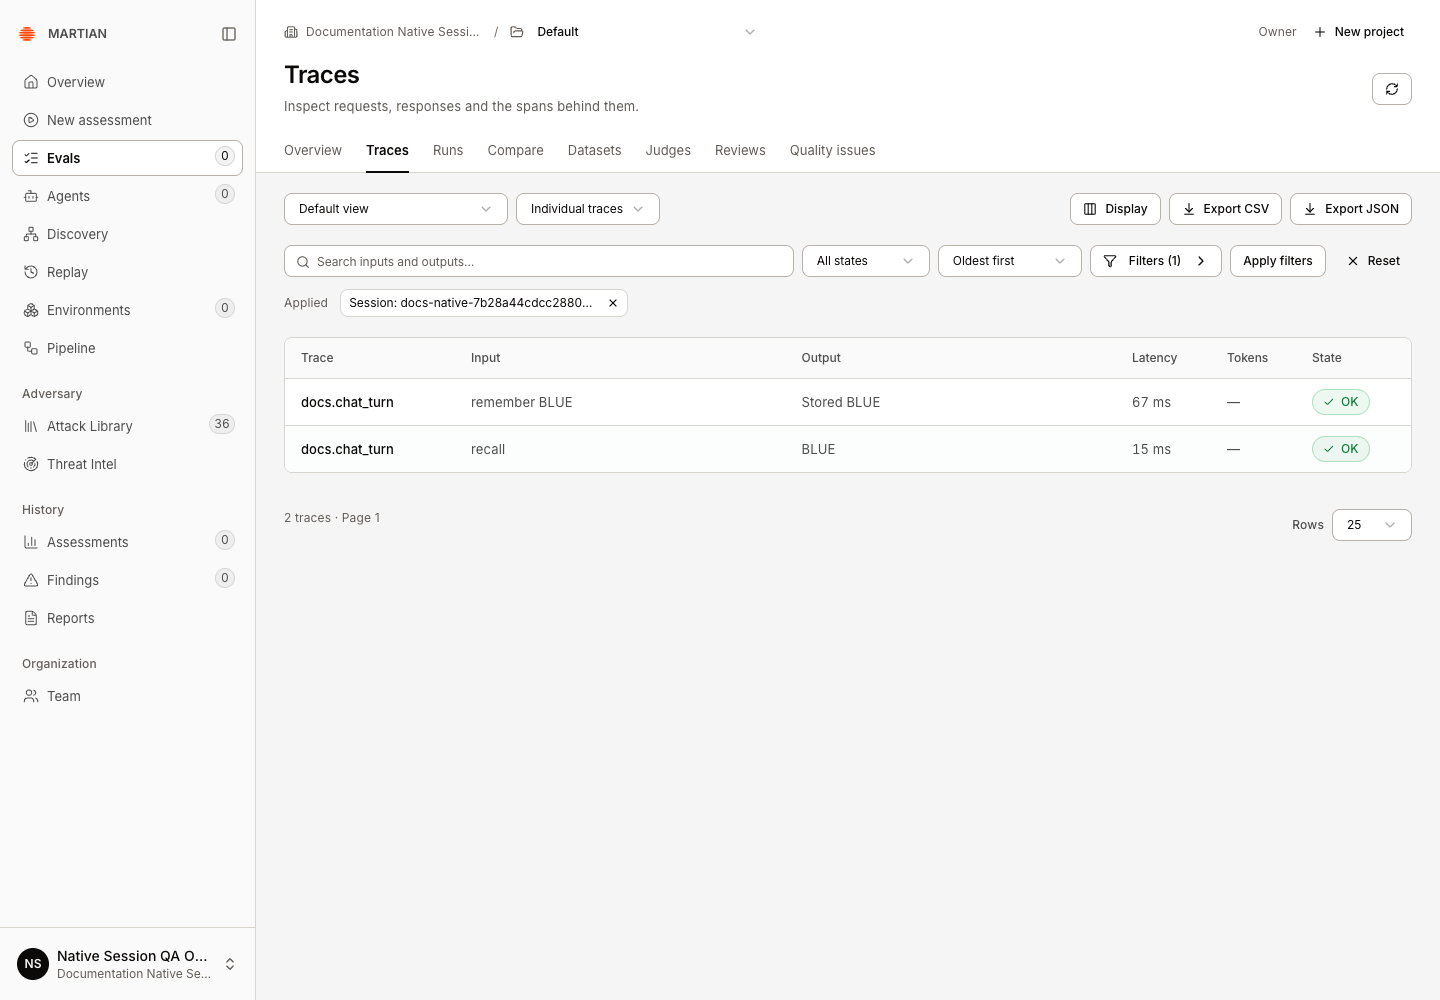
- Open each trace to compare the real request and response. Refresh and confirm that both turns remain. Ungroup traces returns from Sessions to the individual trace table.
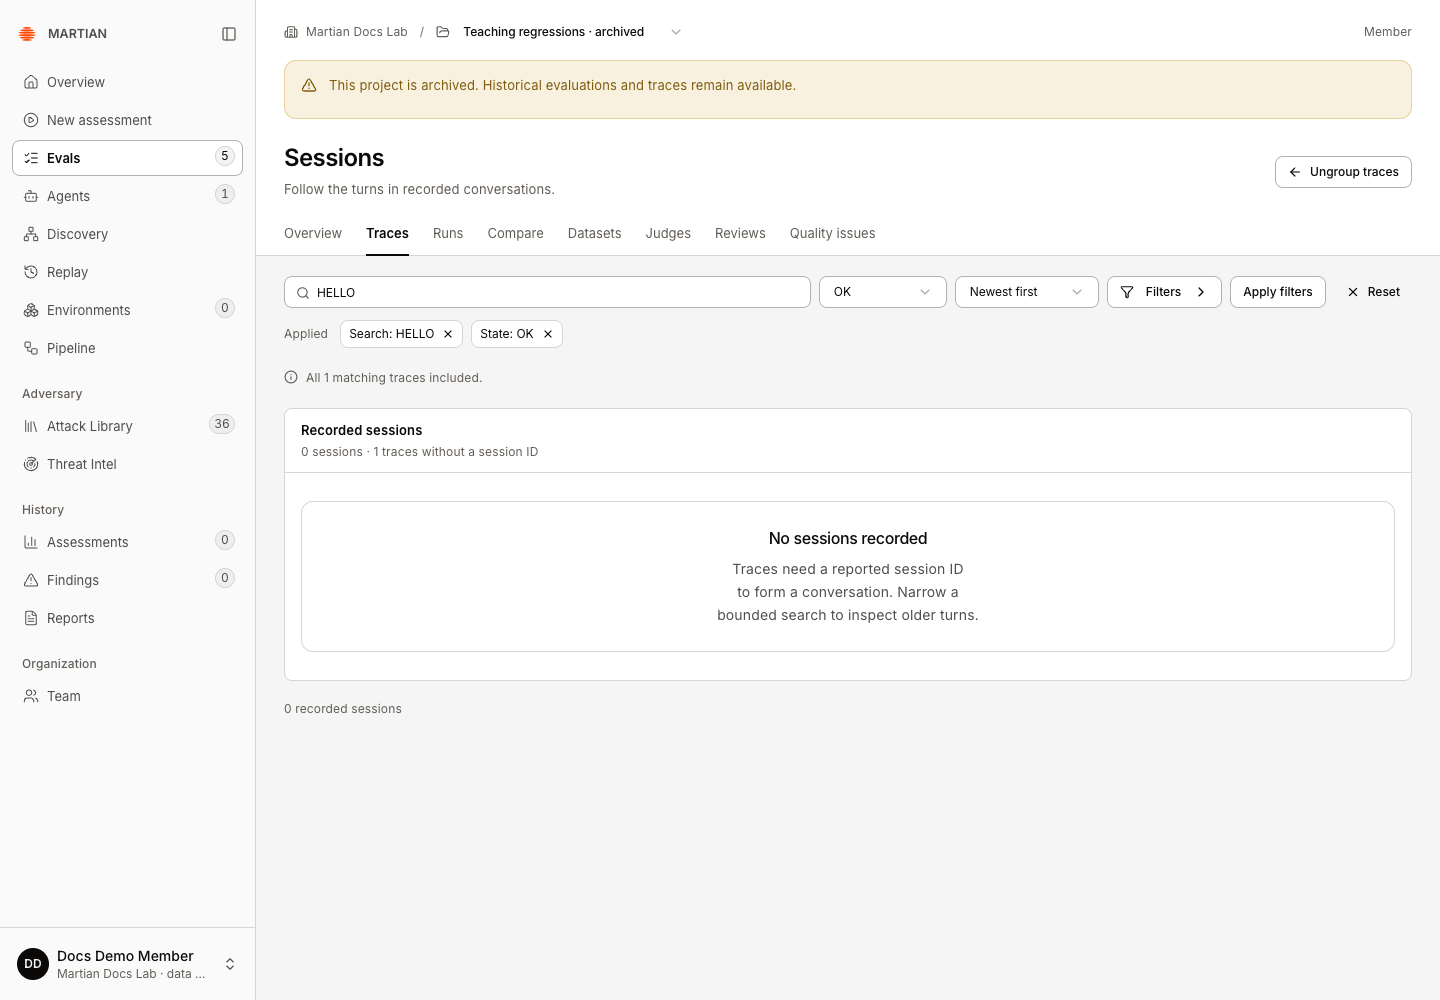
Sessions require a reported session ID. A set of independent dataset requests is not automatically a multi-turn conversation. If you see No sessions recorded, inspect individual traces and confirm that the target/instrumentation reports the session identifiers you expect.
An SDK CI session identifies a pytest upload; it is a different identifier from a conversation session. SDK 0.1.2 dataset and inline-check uploads do not forward local trace session metadata. The separate SDK teaching example below therefore has 0 sessions and 1 matching trace without a session ID. A native integration requires separately provisioned writer access; Martian SDK 0.1.2/API keys do not issue those credentials or provide an equivalent customer trace-ingestion route. Ask your operator about a supported session-bearing integration rather than copying a CI upload ID into this filter.
4. Save a useful view
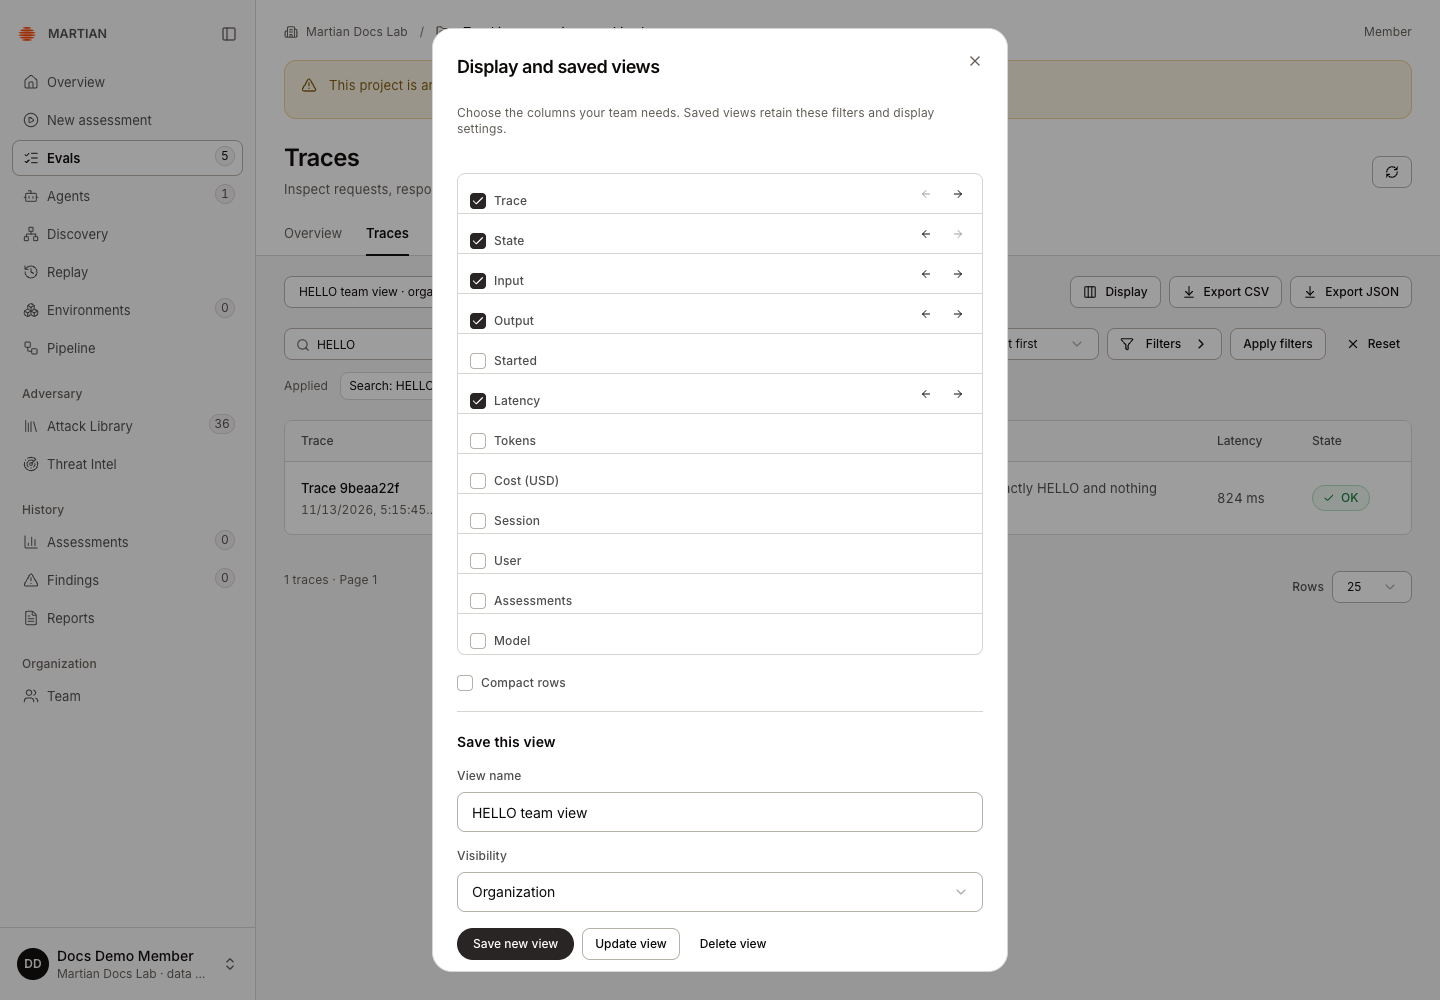
Section titled “4. Save a useful view”- As a member/admin/owner, choose Display; its accessible action is Columns and view settings.
- In Display and saved views, select columns, move them into a useful order, and choose Compact rows if desired.
- Enter View name and choose Visibility: Private or Organization.
- Click Save new view. Select it later using Saved trace view.
- After refreshing, select the view again in Saved trace view, then confirm its saved filters, columns and density. Refreshing opens the default view; it does not automatically reselect your last saved view. Update view saves an authorized revision; Delete view requires confirmation.
Private views belong to their creator. Organization views are readable by the organization; mutation still requires ownership or administrator authority. Saving a view does not save a reusable native pagination cursor or grant new trace access.
5. Export a complete bounded selection
Section titled “5. Export a complete bounded selection”- Apply filters that produce the selection you want.
- Choose Export CSV or Export JSON.
- Inspect the downloaded count and identities against the selection and its coverage note.
- If the export is too large, narrow the filters and export again.
Trace exports support up to 1,000 matching traces and reject an oversized selection instead of silently returning the first 1,000. Overview, session grouping and quality-issue aggregates also inspect bounded selections; read their incomplete-coverage labels. Trace table pages contain up to 100 rows.
Failures and recovery
Section titled “Failures and recovery”Use Refresh traces after a temporary read failure. A stale cursor or changed session can require starting the search again. Quote/backslash content searches can be constrained by the native stored representation; use a distinctive simpler term, IDs or structured filters when needed. Reading/exporting evidence cannot repair missing telemetry and should not trigger a replacement target run.
If a view save reports Failed to fetch or another uncertain result, refresh and inspect Saved trace view before saving again. A new save can create another view; confirm whether the earlier one exists first.
Next, review saved responses or triage quality issues.